Display Multiple Plots
With the subplot() function you can draw multiple plots in one figure:
Example
  import matplotlib.pyplot as plt
import numpy as np

#plot 1:
x =
  np.array([0, 1, 2, 3])
y = np.array([3, 8, 1, 10])

plt.subplot(1, 2, 1)
  plt.plot(x,y)

#plot 2:
x = np.array([0, 1, 2, 3])
y = np.array([10, 20, 30,
  40])

plt.subplot(1, 2, 2)
plt.plot(x,y)

plt.show()

The subplot() Function
The subplot() function takes three arguments that describes the layout of the figure.
The layout is organized in rows and columns, which are represented by the first and second argument.
The third argument represents the index of the current plot.
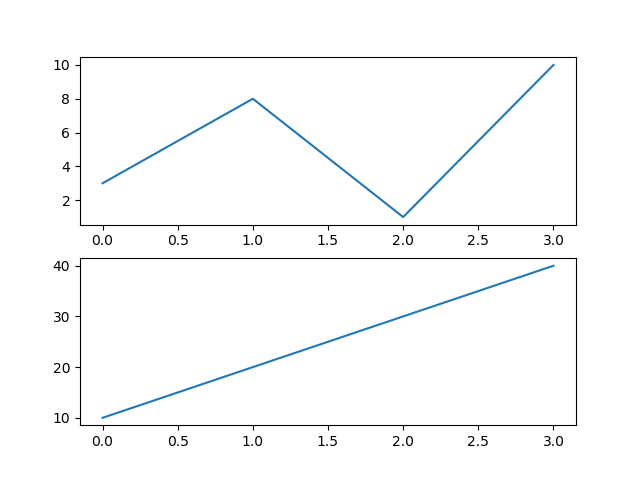
So, if we want a figure with 2 rows an 1 column (meaning that the two plots will be displayed on top of each other instead of side-by-side), we can write the syntax like this:
Example
  import matplotlib.pyplot as plt
import numpy as np

#plot 1:
x =
  np.array([0, 1, 2, 3])
y = np.array([3, 8, 1, 10])

plt.subplot(2, 1, 1)
  plt.plot(x,y)

#plot 2:
x = np.array([0, 1, 2, 3])
y = np.array([10, 20, 30,
  40])

plt.subplot(2, 1, 2)
plt.plot(x,y)

plt.show()
You can draw as many plots you like on one figure, just descibe the number of rows, columns, and the index of the plot.
Example
  import matplotlib.pyplot as plt
import numpy as np

x = np.array([0,
  1, 2, 3])
y = np.array([3, 8, 1, 10])

plt.subplot(2, 3, 1)
  plt.plot(x,y)

x = np.array([0, 1, 2, 3])
y = np.array([10, 20, 30,
  40])

plt.subplot(2, 3, 2)
plt.plot(x,y)

x = np.array([0, 1,
  2, 3])
y = np.array([3, 8, 1, 10])

plt.subplot(2, 3, 3)
plt.plot(x,y)

x = np.array([0, 1, 2, 3])
y = np.array([10, 20, 30, 40])

  plt.subplot(2, 3, 4)
plt.plot(x,y)

x = np.array([0, 1, 2, 3])
y =
  np.array([3, 8, 1, 10])

plt.subplot(2, 3, 5)
plt.plot(x,y)

x
  = np.array([0, 1, 2, 3])
y = np.array([10, 20, 30, 40])

plt.subplot(2,
  3, 6)
plt.plot(x,y)

plt.show()

Title
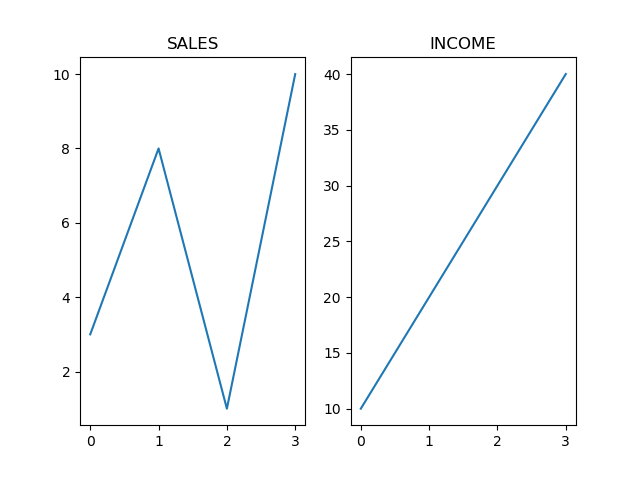
You can add a title to each plot with the title() function:
Example
  import matplotlib.pyplot as plt
import numpy as np

#plot 1:
x =
  np.array([0, 1, 2, 3])
y = np.array([3, 8, 1, 10])

plt.subplot(1, 2, 1)
  plt.plot(x,y)
plt.title("SALES")

#plot 2:
x = np.array([0, 1, 2, 3])
y = np.array([10, 20, 30,
  40])

plt.subplot(1, 2, 2)
plt.plot(x,y)
plt.title("INCOME")

plt.show()
Super Title
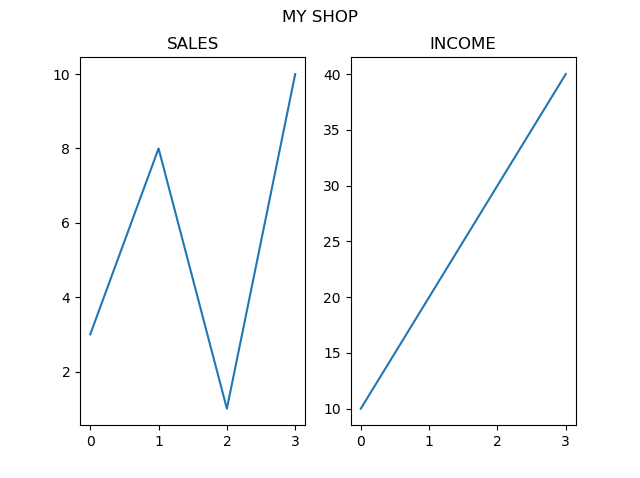
You can add a title to the entire figure with the suptitle() function:
Example
  import matplotlib.pyplot as plt
import numpy as np

#plot 1:
x =
  np.array([0, 1, 2, 3])
y = np.array([3, 8, 1, 10])

plt.subplot(1, 2, 1)
  plt.plot(x,y)
plt.title("SALES")

#plot 2:
x = np.array([0, 1, 2, 3])
y = np.array([10, 20, 30,
  40])

plt.subplot(1, 2, 2)
plt.plot(x,y)
plt.title("INCOME")

plt.suptitle("MY SHOP")
plt.show()