
Data Distribution
Earlier in this tutorial we have worked with very small amounts of data in our examples, just to understand the different concepts.
In the real world, the data sets are much bigger, but it can be difficult to gather real world data, at least at an early stage of a project.
How Can we Get Big Data Sets?
To create big data sets for testing, we use the Python module NumPy, which comes with a number of methods to create random data sets, of any size.
Example
  import numpy

x = numpy.random.uniform(0.0, 5.0, 250)

print(x)
Histogram
To visualize the data set we can draw a histogram with the data we collected.
We will use the Python module Matplotlib to draw a histogram.
Learn about the Matplotlib module in our Matplotlib Tutorial.
Example
  import numpy
import matplotlib.pyplot as plt

x =
  numpy.random.uniform(0.0, 5.0, 250)

plt.hist(x, 5)
plt.show()
Histogram Explained
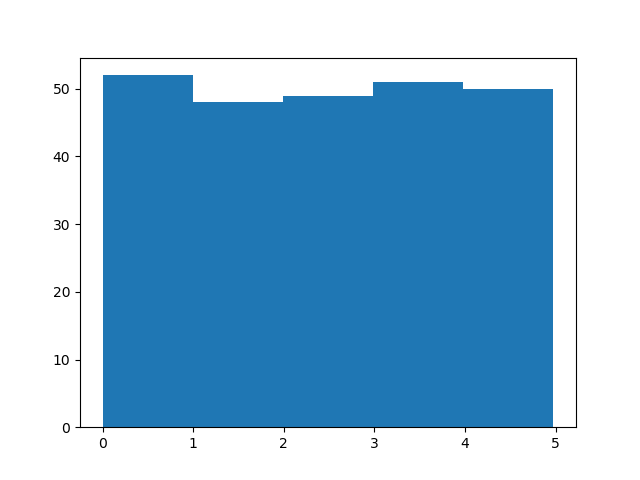
We use the array from the example above to draw a histogram with 5 bars.
The first bar represents how many values in the array are between 0 and 1.
The second bar represents how many values are between 1 and 2.
Etc.
Which gives us this result:
- 52 values are between 0 and 1
- 48 values are between 1 and 2
- 49 values are between 2 and 3
- 51 values are between 3 and 4
- 50 values are between 4 and 5
Note: The array values are random numbers and will not show the exact same result on your computer.
Big Data Distributions
An array containing 250 values is not considered very big, but now you know how to create a random set of values, and by changing the parameters, you can create the data set as big as you want.
Example
  import numpy
import matplotlib.pyplot as plt

x =
  numpy.random.uniform(0.0, 5.0, 100000)

plt.hist(x, 100)
plt.show()
