Add Grid Lines to a Plot
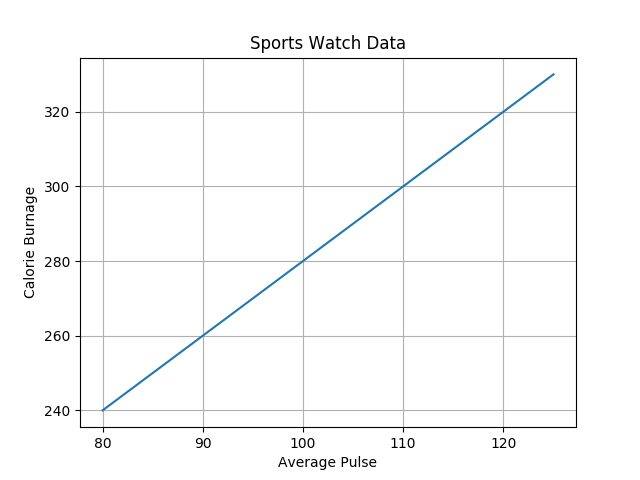
With Pyplot, you can use the grid() function to add grid lines to the plot.
Example
import numpy as np
import matplotlib.pyplot as plt

x = np.array([80,
  85, 90, 95, 100, 105, 110, 115, 120, 125])
y = np.array([240, 250, 260,
  270, 280, 290, 300, 310, 320, 330])

plt.title("Sports Watch Data")
  plt.xlabel("Average Pulse")
plt.ylabel("Calorie Burnage")

plt.plot(x,
  y)

plt.grid()

plt.show()
Specify Which Grid Lines to Display
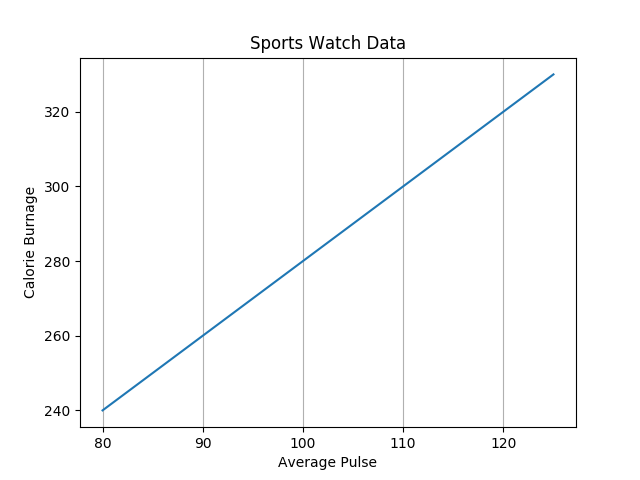
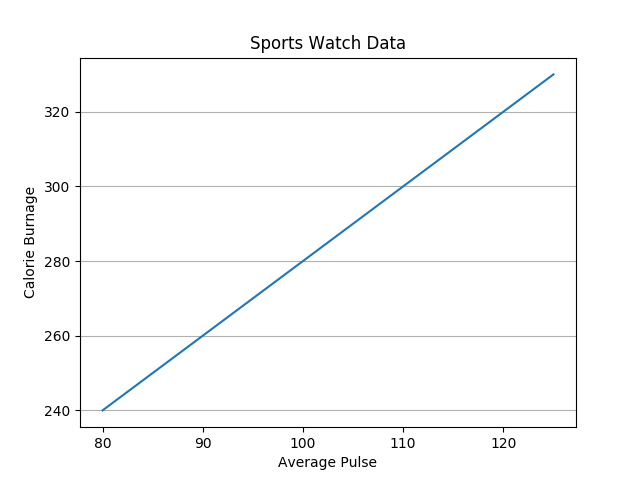
You can use the axis parameter in the grid() function to specify which grid lines to display.
Legal values are: 'x', 'y', and 'both'. Default value is 'both'.
Example
import numpy as np
import matplotlib.pyplot as plt

x = np.array([80,
  85, 90, 95, 100, 105, 110, 115, 120, 125])
y = np.array([240, 250, 260,
  270, 280, 290, 300, 310, 320, 330])

plt.title("Sports Watch Data")
  plt.xlabel("Average Pulse")
plt.ylabel("Calorie Burnage")

plt.plot(x,
  y)

plt.grid(axis = 'x')

plt.show()
Example
import numpy as np
import matplotlib.pyplot as plt

x = np.array([80,
  85, 90, 95, 100, 105, 110, 115, 120, 125])
y = np.array([240, 250, 260,
  270, 280, 290, 300, 310, 320, 330])

plt.title("Sports Watch Data")
  plt.xlabel("Average Pulse")
plt.ylabel("Calorie Burnage")

plt.plot(x,
  y)

plt.grid(axis = 'y')

plt.show()
Set Line Properties for the Grid
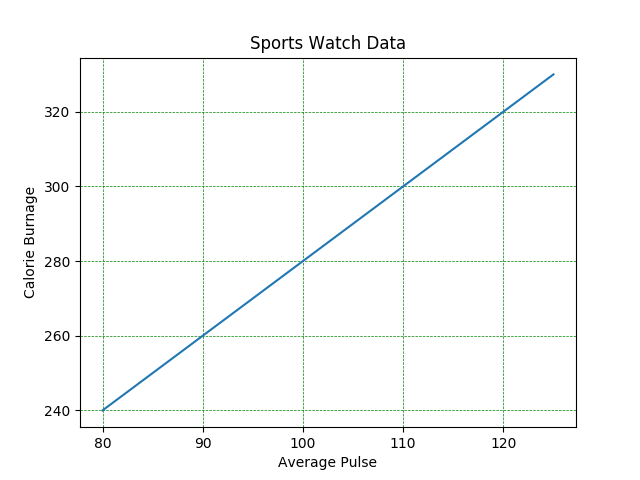
You can also set the line properties of the grid, like this: grid(color = 'color', linestyle = 'linestyle', linewidth = number).
Example
import numpy as np
import matplotlib.pyplot as plt

x = np.array([80,
  85, 90, 95, 100, 105, 110, 115, 120, 125])
y = np.array([240, 250, 260,
  270, 280, 290, 300, 310, 320, 330])

plt.title("Sports Watch Data")
plt.xlabel("Average
  Pulse")
plt.ylabel("Calorie Burnage")

plt.plot(x,
  y)

plt.grid(color = 'green', linestyle = '--', linewidth = 0.5)

plt.show()