R - Squared
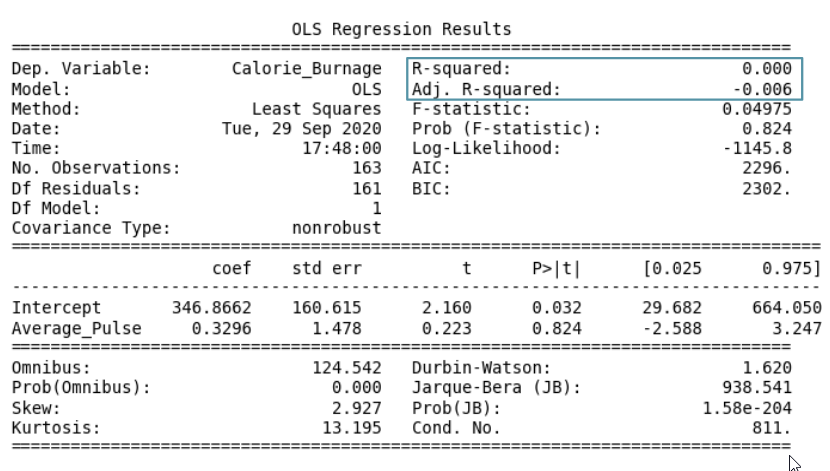
R-Squared and Adjusted R-Squared describes how well the linear regression model fits the data points:
The value of R-Squared is always between 0 to 1 (0% to 100%).
- A high R-Squared value means that many data points are close to the linear regression function line.
- A low R-Squared value means that the linear regression function line does not fit the data well.
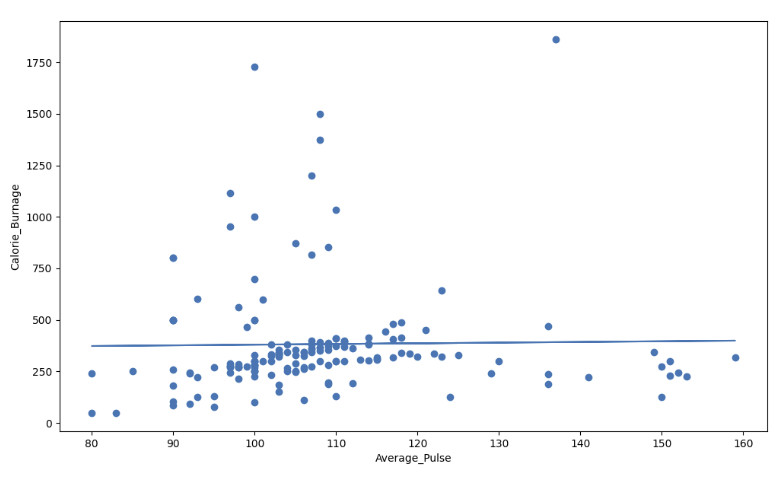
Visual Example of a Low R - Squared Value (0.00)
Our regression model shows a R-Squared value of zero, which means that the linear regression function line does not fit the data well.
This can be visualized when we plot the linear regression function through the data points of Average_Pulse and Calorie_Burnage.
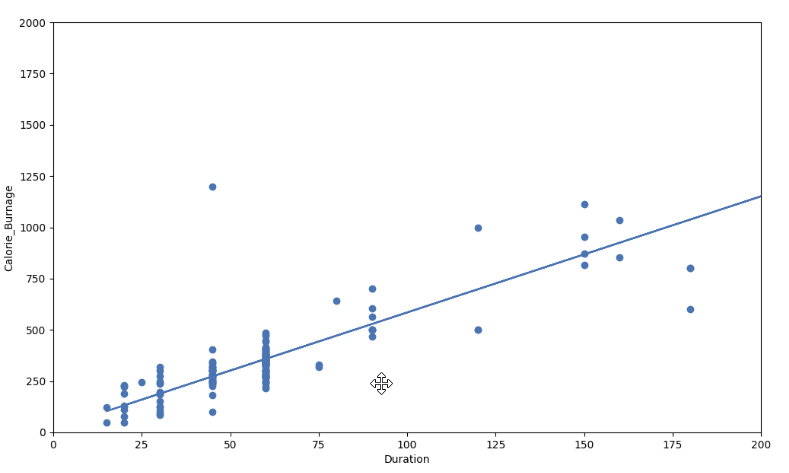
Visual Example of a High R - Squared Value (0.79)
However, if we plot Duration and Calorie_Burnage, the R-Squared increases. Here, we see that the data points are close to the linear regression function line:
Here is the code in Python:
Example
import pandas as pd
import matplotlib.pyplot as plt
from scipy
import stats

full_health_data = pd.read_csv("data.csv", header=0, sep=",")

x = full_health_data["Duration"]
y =
full_health_data ["Calorie_Burnage"]

slope, intercept, r, p, std_err =
stats.linregress(x, y)

def myfunc(x):
 return slope * x + intercept

mymodel = list(map(myfunc, x))

print(mymodel)

plt.scatter(x,
y)
plt.plot(x, mymodel)
plt.ylim(ymin=0, ymax=2000)
plt.xlim(xmin=0,
xmax=200)
plt.xlabel("Duration")
plt.ylabel ("Calorie_Burnage")

plt.show()
Summary - Predicting Calorie_Burnage with Average_Pulse
How can we summarize the linear regression function with Average_Pulse as explanatory variable?
- Coefficient of 0.3296, which means that Average_Pulse has a very small effect on Calorie_Burnage.
- High P-value (0.824), which means that we cannot conclude a relationship between Average_Pulse and Calorie_Burnage.
- R-Squared value of 0, which means that the linear regression function line does not fit the data well.
